Women as candidates
In 1907–1954, the list voting system was applied in Finland. A voter would not vote for an individual candidate, but the party instead. Before the election, the party had placed its candidates on the list in a certain order based on its own member vote or similar. When counting the votes, the candidates were elected in the order they were placed on the list.
Since 1955, the current system of a combined individual and party voting elections system has been used. The voter casts a vote for one candidate and, as the candidate usually stands for a party, the vote is allocated to the party, too.
The Statistical Office did not record the number of female candidates in the 1907–1919. In the 1922–1936 elections, the female number of candidates reached the highest rate, at 8.3%, in 1927. The low count of female candidates was constantly highlighted in elections statistics, because there were more eligible female than male voters. In the 1936 election there were 1,072 eligible women voters per 1,000 male voters.
Before the World Wars, it was the practice not to nominate several female candidates in order to have at least one woman elected. On the other hand, there was a shortage of female candidates ‑ a woman's place was still at home. However, it was almost the norm to have at least one female candidate for each electoral district.
After the wars, the percentage of women in candidates started to grow. Still, to this day, the proportion of women candidates does not correspond with the share of women among eligible voters. In the 2019 parliamentary election, women made up 42.0 per cent of the candidates, even though 51.4 per cent of eligible voters are women.
Proportion of female candidates
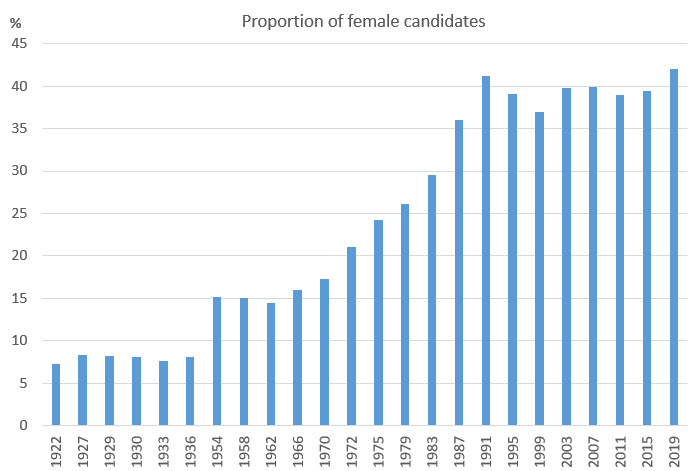
Figure 2. Proportion of female candidates, %
Data from 1939, 1945 and 1948 unavailable. Detailed number data in
the Appendix
The proportion of votes cast for women has been recorded in the 1954–2007 elections. However, as early as 1927 the Election statistics concludes, on the basis of observing the number of female Members of Parliaments:
"The female voters, despite a majority by numbers, has in rather scarce numbers taken advantage of the opportunity, as laid down in the Elections Act, to choose a representative of the same sex."
In the moment of voting, the vote is always cast to a male or female candidate. It is more common to vote one's own sex among men than it is among women. According to studies (e.g. Pikkala in Poliittisen osallistumisen eriytyminen: eduskuntavaalitutkimus 2015, 2016), women increasingly vote for women. In the 1970 election, 40 per cent of female voters gave their vote to women. This figure was at its highest in the 1991 parliamentary election, where 58 per cent of women cast their vote for female candidates. Since then, the percentage of women voting for women has been slightly over 50. In the 2015 election, 52 per cent of female voters gave their vote to women.
No similar study has yet been completed of the 2019.
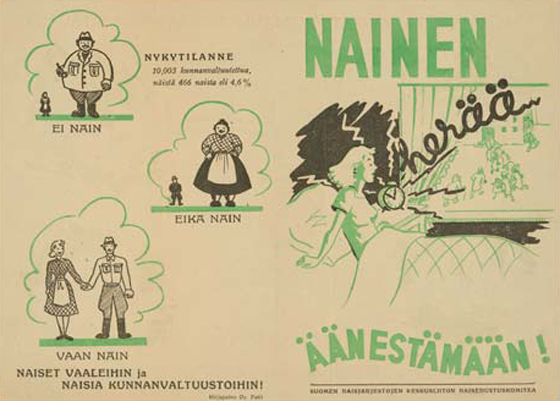
A poster from the 1930s. National Archives of Finland.